All the work, described
What each piece is, what it looks like and how it works
Every piece on this site is live, and most of them are meant to be played with. This page is for when you can't: on a phone in a meeting, reading a summary later, or if you're an AI assistant that can't click through a game. Each entry says what the piece is, who it was for, what it looks like, every option you get, and what happens when you use it.
Most of these were built in autumn 2026 for a European maker of bonding routers, as one brief that grew step by step. They're shown without the client's name or branding. Demos use invented or sample data and generic product names. Carriers in the games are parodies.
- Chaos-Proof (game)
- Keep the Call Alive (first version of the game)
- The Braid
- When the Fibre Fails
- One Office, One Cut
- Stay On Air
- Same Call, Different Router
- Fibre Cut Walkthrough
- One Connection, Many Paths
- Activity Intelligence
- Build floor
- Router Build Guide
- Tunnel Setup Guide
- Chaos Scout
- Whacky Weather
Chaos-Proof


What it is
A game that teaches the difference between a single internet line, basic failover, SD-WAN load balancing and connection bonding, and why the mix of lines and contracts matters as much as the router. A run takes about a minute and needs no sign-up.
What it looks like
A bright, cartoon world in a night-sky purple palette with lime-green signal lines. Phone masts, vehicles and buildings are drawn as flat illustrations. During a mission, a large "camera" view shows the scene (a stadium car park, a wind farm, a city street with an ambulance, a desert festival), with a ticking clock, a month-long progress bar, the money spent and a live status banner. Beside it runs a spoof social media feed of fake posts, snapshots and newspaper headlines reacting to whatever just happened. Sound effects are optional.
Options
- Four missions: Broadcast van (eight matches live from the car park, hard), Remote office (a month of video calls from a wind farm, medium), Ambulance (a month on call sending live patient readings, extreme) and Festival (three days of card payments in the desert, hard).
- Step 1, connections: pick up to four from a set of mobile, satellite, DSL, fibre and leased-line plans from parody carriers (an old giant with the best coverage and highest prices, a carrier where every offer has small print, a cheap one that's slowed first when masts are busy, a satellite company, and a drone-delivery carrier). Each has a headline price, signal strength and small print. Quick-pick buttons: Surprise me, Headline shopper and I read the small print. A budget counts headline prices; the true cost is revealed after the test.
- Step 2, tactic: Single line, Basic failover, SD-WAN (load balancing) or Connection bonding.
- During a run with any tactic except bonding, you can tap a connection to move the stream onto it by hand.
- Buttons for sound, full screen and "Draft rules", which opens the full simulation rules for technical review.
What happens
The mission plays as a time-lapse of a real period (a month of match days, a month on call, a working month, a festival weekend), racing between problems and slowing to real time for each one so you can watch the switchover. Everyday problems hit your connections: crowds, mast outages, storms, an unpaid electricity bill, and once per run a catastrophe that takes out two networks at once. Small print bites too: data caps throttle, daily rations run out, EU-only roaming fails when the ambulance crosses into Switzerland. Sometimes a drone drops off a spare SIM. With failover and SD-WAN, every switch costs seconds off air; with bonding, the remaining links carry the stream and you see a short blip instead of a drop.
What it shows at the end
A score out of 1,000 (points lost for minutes off air, minutes degraded and interruptions; bonus for network diversity and a clean run), a rank, a timeline of what your network faced, the real monthly bill including setup fees and top-ups, and what the outages would have cost (sponsor make-goods for the van, lost working time for the office, customers walking off at the festival, missed readings for the ambulance). One button replays the same disasters with connection bonding so you can compare.
Keep the Call Alive

What it is
The first playable version of the game that became Chaos-Proof. Once the full explainer worked, the quickest way to show everything it did was to let people play with it.
What it looks like and how it works
A dark navy, card-based interface without the illustrated world of Chaos-Proof. The same four missions (each says what you must keep alive: live video, patient data, the video call or card payments), the same two steps (pick up to four connections within a budget, then choose a tactic), the same time-lapse stress test with a viewers' screen and bill, and the same score out of 1,000 with a "replay with connection bonding" button. It shows how a game can be white-labelled for a vendor or reseller.
The Braid

What it is
One picture of the whole idea. Most routers give each connection one line; bonding spreads every connection across all of them. Everything after it grew from this.
What it looks like
Two stacked panels on a pale background. In each, three lanes (fibre, 4G and 5G) carry streams of small coloured dots, one colour per person: Anna's Teams call, Ben's Dropbox upload and Clara's Salesforce session. In the top panel ("Most routers") each person's dots stay on one lane. In the bottom panel ("Connection bonding") the dots weave across all three lanes, like a braid.
What happens
The fibre is cut. In the top panel, everything on the fibre stops: Anna's call shows DROPPED and Ben's upload FAILED, and a packets-lost counter climbs. In the bottom panel the braid simply tightens onto 4G and 5G and all three stay live. Controls: Pause, Replay, Hide details and Clean view (which removes labels for a cleaner social clip). A link leads to the second-by-second walkthrough. Timings are compressed and counts are illustrative.
When the Fibre Fails

What it is
A side-by-side comparison of load balancing (as used by many SD-WAN products) and connection bonding, using three people in one office with three lines from three different carriers.
What it looks like
Two clean diagrams on a white background. On the left of each, three cards for the people's work: a laptop uploading a PDF with a progress bar, a phone call with a running timer, and a cloud app updating a CRM. In the middle a router, on the right the internet and cloud, joined by three curved lines (fibre, 4G, 5G). The bonding diagram adds a bonding hub and labels the lines "one encrypted tunnel". Colours mark each kind of traffic.
What happens
The fibre line fails. With load balancing, every session on the fibre breaks: the upload fails at 64%, the call ends and the app loses unsaved changes, and a counter drops to 0 of 3 people working until the router fails over and everyone starts again. With bonding, 4G and 5G were already carrying the traffic, so the call continues, the upload carries on and the app saves: 3 of 3 working. A short paragraph under each explains why. Controls: Pause and Replay.
One Office, One Cut

What it is
The office version scaled up: twenty people on fibre, 4G and 5G, and what each of them loses when a digger cuts the fibre in the street. Anna is closing a €48,000 contract on a Teams call, Ben is approving supplier payments in online banking and Clara is taking a €4,800 card payment at reception.
What it looks like
Packet "ribbons" for each line, then a floor plan of twenty desks. Each person is a small figure coloured by what they're doing (Teams calls, online banking, card payments, web and email), with dots of traffic flowing from their desk to the service they use and a label showing which line their work runs on. A ring around each figure turns red when their work stops and amber while it recovers. Scoreboards for both routers count people interrupted out of 20, calls cut off, total call silence, voice packets lost and payments interrupted. An event log beside each router prints what the router sees, millisecond by millisecond.
What happens
The failover router keeps sending into the dead fibre until three health checks fail, then moves sessions to lines with different public addresses, so calls, banking sessions and card payments have to reconnect. The bonding router stops using the fibre within a fraction of a second, and the address the services see doesn't change. Controls: Pause, Replay, speed, a light or dark theme, and full screen.
Stay On Air

What it is
An outside broadcast at a marathon finish, running on three mobile carriers. Seven feeds leave the van: two cameras, the presenter's earpiece, producer talkback, live results graphics, a social editor uploading clips and an engineer's remote monitoring. Then the crowd overloads Carrier A's cell.
What it looks like
An illustrated scene: the finish line, runners and crowd, the van with its numbered feeds, three masts and the broadcast centre with a "what viewers see" screen. To the right, a list of the seven feeds, each with a coloured square for the carrier it's using and a live status (Live to studio, Earpiece silent, Upload failed). Tabs show further scenarios planned for a construction site and an office.
What happens
Switch between Load balancing and Connection bonding and replay the same failure. With load balancing, each feed rides one carrier, so the feeds on Carrier A drop (the picture freezes, the earpiece goes silent, the upload fails) and only 4 of 7 stay live while failover restarts them. With bonding, every feed rides all three carriers inside one encrypted tunnel, so the picture stays on air.
Same Call, Different Router


What it is
A story everyone recognises: Anna is closing a €48,000 contract on a Teams call when a digger cuts the fibre in the street. Two offices, identical except for the router.
What it looks like
Two illustrated video calls side by side, each with the customer's face, Anna's self-view, live captions of what the customer is saying and a deal badge (In discussion, At risk, Deal agreed). Next to each call, a small diagram of the call's packets across fibre, 4G and 5G, and three live numbers: call uptime, packets lost and seconds of silence. A timeline bar marks the cut, the moment it's detected, the moment the call is back and the outcome. Below, "ribbons" show 28 seconds of traffic for everyone in the office, with holes wherever nothing got through.
What happens
On the ordinary router the customer freezes mid-sentence, nine seconds of silence cost the moment, and the deal moves to next week. Ben's upload stalls and resends. On the bonding router a few voice packets are lost, too few to hear, and the deal is agreed: neither of them knew a line had failed. Controls: Pause, Jump to the cut, speed (including slow motion) and Replay.
The calculator
"What does one line failure cost you?" Enter the number of people who depend on the connection, the cost of a working hour, line failures a year, minutes lost per failure, customer calls at a typical moment, and currency (euro, pound or dollar). It shows the yearly cost in lost working time, hours lost, customer calls cut off and the cost of a single failure, with the formula written out.
Fibre Cut Walkthrough

What it is
The same fibre cut, slowed down for people who want the mechanics: what the router sees, when it notices, and what each app experiences, for load balancing and for bonding.
What it looks like
Two network diagrams, each with the office devices (a laptop uploading a 2.4 GB archive, a headset on a Teams call, a desktop with Salesforce open), the router, the three lines with their carriers and public addresses, and the destinations. Beside each diagram, a dark terminal-style event log prints timestamped lines (LINE, ROUTER, TUNNEL, UPLOAD) as things happen. The bonding diagram shows an encrypted tunnel to a hub in a data centre.
What happens
With load balancing, each app is tied to one line. When the fibre dies, data vanishes into the dead line, the upload stalls with no receipts coming back, the call goes silent, and the log shows health check 1, 2 and 3 being missed before anything moves. With bonding, the log shows the tunnel dropping the fibre and the hub putting packets back in order, while the apps carry on. Controls: Pause, Jump to the cut, speed and Replay.
One Connection, Many Paths

What it is
Everything the earlier sketches built up to: a configurable simulator that runs a conventional failover router and a bonding router on the same links and the same people, so you can cut a link and watch what each does.
What it looks like
A dark "lab" screen. People on site are grouped by what they're doing; glowing dots travel from them through the router, along each link (labelled with carrier and speed) and on to the services they use. The conventional side reaches the internet with a different public address per link; the bonding side runs through one tunnel to a hub. Live readouts compare throughput, a race to send one large file (shown speeded up), sessions dropped, call silence and link status.
Options
- Router: desktop (Ethernet WAN plus three module slots for 4G, 5G, VDSL or Ethernet), mobile (three 4G modems with two SIMs each, plus Ethernet ports for links such as Starlink) or rack (seven Ethernet WAN ports).
- Scenario: outside-broadcast van or construction site office. Traffic direction: upload from site or download to site.
- WAN links: turn each on or off, set its speed, and add Starlink, fibre, DSL, cable, 5G or 4G.
- People on site: how many on video calls, live video, cloud sync and web and email, plus the size of one large file.
- Assumptions: bonding tunnel overhead; all other assumptions are written out under the diagram.
- Views and controls: show both routers, conventional only or bonding only; Cut busiest link; Restore links; Pause; Restart; Split view; Presenter mode for sales calls; Demo mode that runs by itself on a trade-show screen; full screen. Click a link's label to cut it.
What happens
Cut a link and the conventional router keeps sending into it until three health checks fail, then sessions reconnect over another link with a different address: calls rejoin, uploads restart and the large file starts again from zero. The bonding router stops using the link in a fraction of a second and everything carries on with less capacity. Restoring a link shows another difference: conventional sessions stay where they were moved, while bonding uses the restored link straight away. A "What is modelled" section lists every number the model uses.
Activity Intelligence
What it is
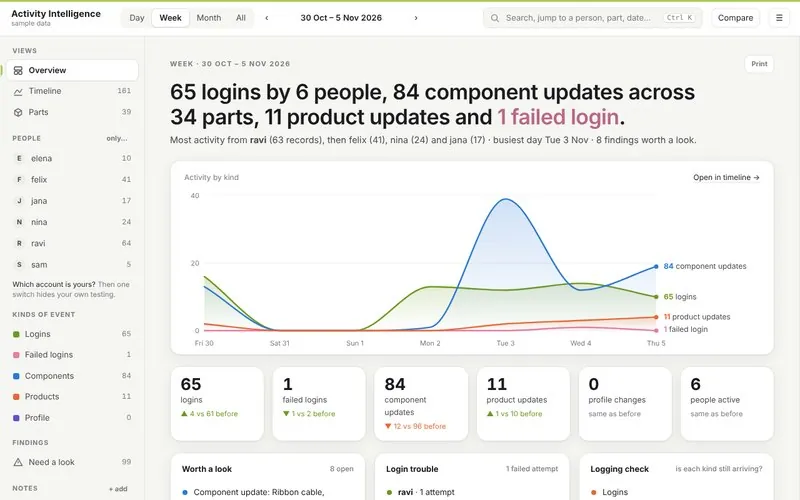
A dashboard that makes sense of an inventory system's activity log: who has access, who did what and when, and the trail behind every change. It runs inside the company's own network and can't be reached from the internet, so the log data never leaves the building.
What it looks like
A clean, light dashboard. Each period opens with a plain-English sentence summarising what happened, then a line chart of activity by kind, tiles comparing each count with the previous period, and panels for findings worth a look, login trouble and a logging check (is each kind of event still arriving?).
What you can do
- Switch between day, week, month and all time, and step back and forward.
- Views: Overview, Timeline and Parts. Search or jump to a person, part or date. Compare two periods. Print.
- Filter by person (with a switch to hide your own test account) and by kind of event: logins, failed logins, component updates, product updates and profile changes.
- Findings flag things worth a look: password guessing, odd-hour logins, repeated identical saves, a stock count with an extra zero.
- Add notes to mark releases, stock takes or test sessions by double-clicking the timeline.
Build floor
What it is
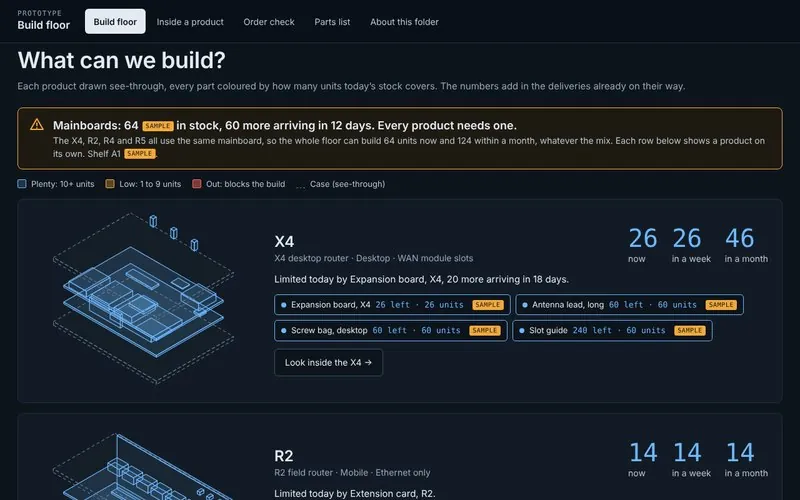
The visual side of the inventory tools, built for sales. It reads stock from the company's inventory system (by querying it, or by being kept updated from it) and answers the questions sales and management ask: can we fill this order today, and if not, what's missing and needs ordering? Like Activity Intelligence, it runs inside the company's own network and can't be reached from the internet.
What it looks like
A dark interface. Each product (a desktop router and three mobile models) is drawn as a see-through isometric sketch, with every part coloured by how many units its stock covers: plenty, low or out. Three big numbers show how many units can be built now, in a week and in a month, counting deliveries already on their way, with the limiting part named. Below that, the month's build plan is checked against stock, with a list of exactly what to order to hit it. Sample numbers are clearly tagged SAMPLE and estimates EST. The drawings are sample sketches; in a live version they can be drawn from photographs of the real products.
What you can do
- Build floor: how many of each product can be built now, in a week and in a month, the tightest parts, and what to order to hit the monthly plan.
- Inside a product: every part in one product, where it's used and what it does.
- Order check: an order comes in for 20 routers. The salesperson types it in, in plain words, and it says whether they can be built today, which parts are missing, and when a booked delivery will cover them.
- Parts list: the full list, exportable as CSV.
- About this folder: how the data works and how to update it.
Router Build Guide

What it is
A photo-led, step-by-step assembly guide for a family of mobile bonding routers, with quality checks. It replaced scattered notes on the factory floor.
What it looks like and how it works
Sections run across the top as a progress bar: case prep, boards, assembly for QA, QA flash, final assembly, production, and open questions. Each section starts with chips for every part it uses (with quantities and small icons), then numbered steps. Each step has a large bench photo, lettered so the text can refer to it, and short instructions beside it. A Short / Full detail switch shows quick bench steps or the full explanation. Violet boxes mark where the three models differ, and every line says whether it came from the official build sheet or the recorded build.
Tunnel Setup Guide
What it is
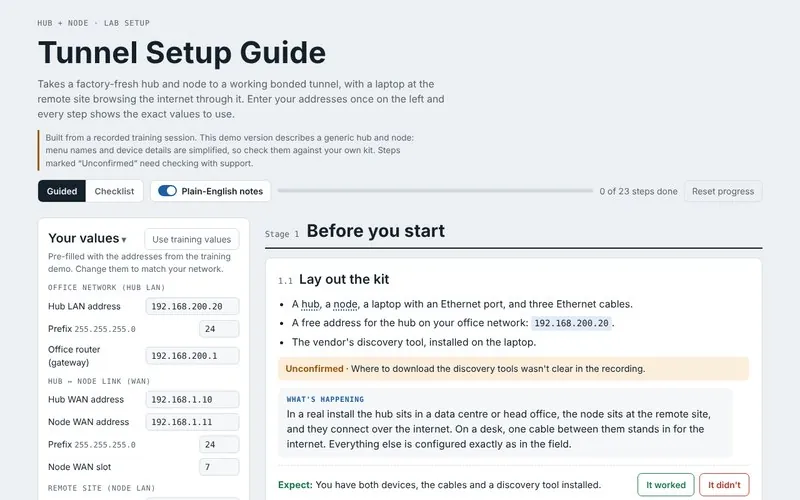
A plain-English walkthrough that takes a factory-fresh hub and node to a working bonded tunnel, with a laptop at the remote site browsing the internet through it. It turns a training session people forget into something they can follow.
What it looks like and how it works
- A "Your values" panel: enter your own addresses (hub LAN, gateway, hub and node WAN, node LAN, DHCP range, tunnel name and password) or use the training values. Every step then shows the exact values for your network.
- A network diagram that turns green as each part is set up and checked.
- 23 steps in seven stages: before you start, set up the hub, set up the node, build the tunnel, routing and NAT, DNS and DHCP, and an end-to-end test.
- Guided or Checklist mode, optional plain-English "What's happening" notes, troubleshooting at every step, progress saved as you go, and steps marked "Unconfirmed" where the recording wasn't clear.
Chaos Scout

What it is
A lead finder that spots companies with a reason to buy now. Each lead comes ranked and tells sales who's buying, who to call, how to reach them and what to say, with the evidence behind it and a draft first message. I also run my own edition to find work for myself, which is why it's licensed rather than handed over. If I've contacted you, it's probably how I found you.
Whacky Weather

What it is
A weather app for Koh Phangan, the island I live on, designed so you can read the day at a glance. People on the island who run outdoor events check it before making expensive calls. I designed it, built it and run it, and it updates itself.
What it looks like
A neon-sign title and round dials, like clock faces, showing what's coming over the next 12 hours so you can plan your day or your night at a glance. The dial shows what each hour will actually look like: at seven in the morning on a sunny day, the face is a bright yellow sky with a smiling sun and clouds; on a clear night it turns dark blue and fills with stars, a sleepy moon, and the planets and constellations that are visible in each hour of the night. A hand points to the time now, with the temperature and a short plain-English forecast ("Sunny, no change. Breezy."). A cartoon ginger cat naps beside the dial.
How it works
It runs on live forecast data and rain radar, and draws the sky for each hour from them, including which stars and planets are up. It is made for phones, can be added to the home screen like an app, and works for any location in the world, not just Koh Phangan. It also produces its own graphics for social media.